Getting your Facebook ads running like a well-oiled machine is harder than making your kid quiet when you work from home. Believe me, I know what I’m talking about. Unlike my kid, Facebook ads are highly unpredictable. Unless you’re an oracle, it’s impossible to forecast if people will like your ads, which images will catch their attention, and what changes will cause your regular “improvements”.
In this article, I’ll show you:
- how I halved CPM after a dramatic budget reduction.
- how to avoid worldwide targeting traps and saving your money.
- which invisible factors can cause CPM and how to analyze them with Facebook Marketing API.
In the end, I am going to share my “Exclusive Scaling Secret”. All you need is to read till the end…
Scaling your Facebook advertising means increasing your ad spend while maintaining a positive return. To help you successfully transition from a $50 daily ad spend to $500, there are tons of great strategies and tactics on the Internet. But, sometimes you need to decrease your daily budget for campaigns or groups.
I used to decrease the daily budget for unprofitable but still promising campaigns. It’s more about my inability to admit my own mistakes of my excessive faith in the future. It’s difficult to say goodbye to a campaign that used to be successful and I tend to give it a second chance limiting my daily losses. I am not pretty sure if it is a good strategy or not, but it helped me to discover some interesting features of the Facebook Ad delivery system. I noticed the findings because of my campaign management habit – I used to have a “changelog”. It is a text file, where I put all important changes and analyze them over time. It takes a lot of time but is essential for successful accounts. It helps me to figure our efficient Principles of Facebook Advertising and, even more important, to improve them over time.
A couple of words about the analysis, Facebook Ads Manager, and Ads Reporting cover 80% of data needed, but sometimes I use RStudio to get more data from Facebook Marketing API and build custom reports.
Let’s jump to the case that confused me so much.
The Advertising Settings were:
- Budget: Starting at $150, decreased to $50 a day, campaign budget optimization, highest value or lowest cost bid strategy
- Countries: Worldwide, broad targeting.
- Language: English.
- Duration: 20 days.
- Total budget: $1800.
- Optimization strategy: App installation.
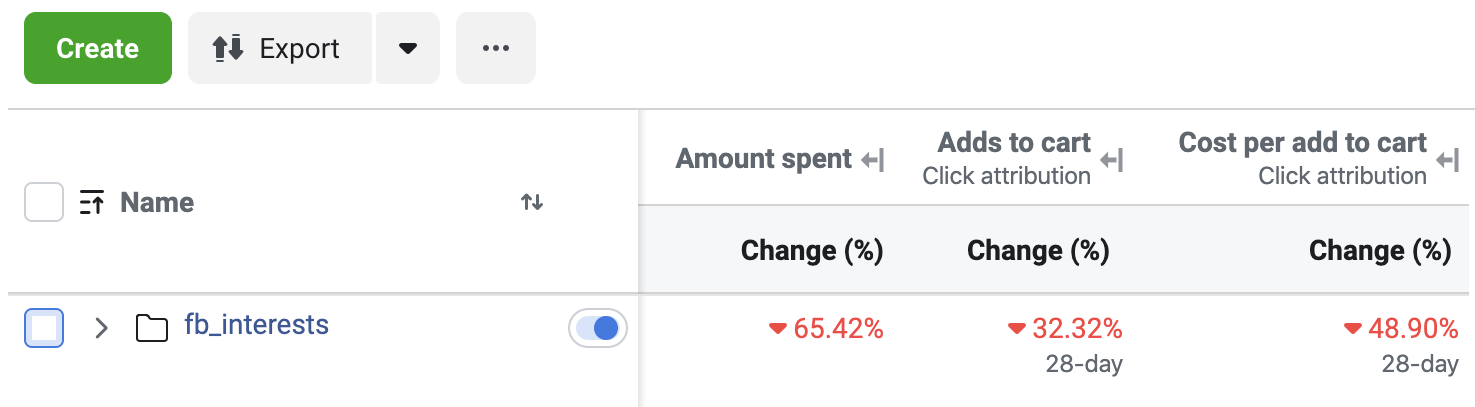
The campaign became expensive and I decided to decrease the daily budget by 65% from $150 to $50 expecting to have -65% of app installs for the same CPI (cost per install).
But the outcome was different. Absolutely.
As a result, I got -32% App Installs and CPI decreased by 49%.
Repeat, decreasing the daily budget by 65% caused CPI to decrease by 49%.
I was shocked to see the results and spent a lot of time figuring out the reasons for the outcome.
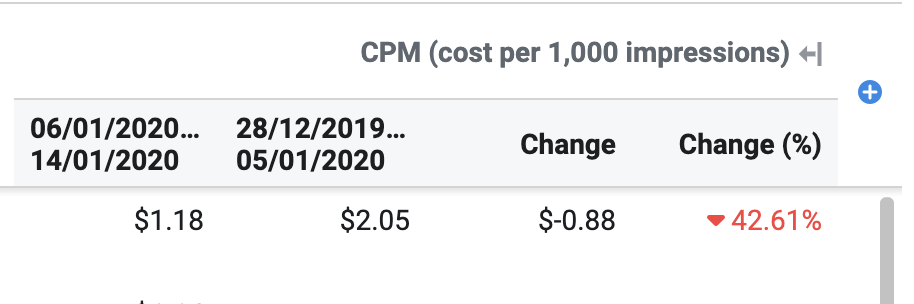
It was easy to notice a sharp decrease in CPM -42%.
Spending by countries
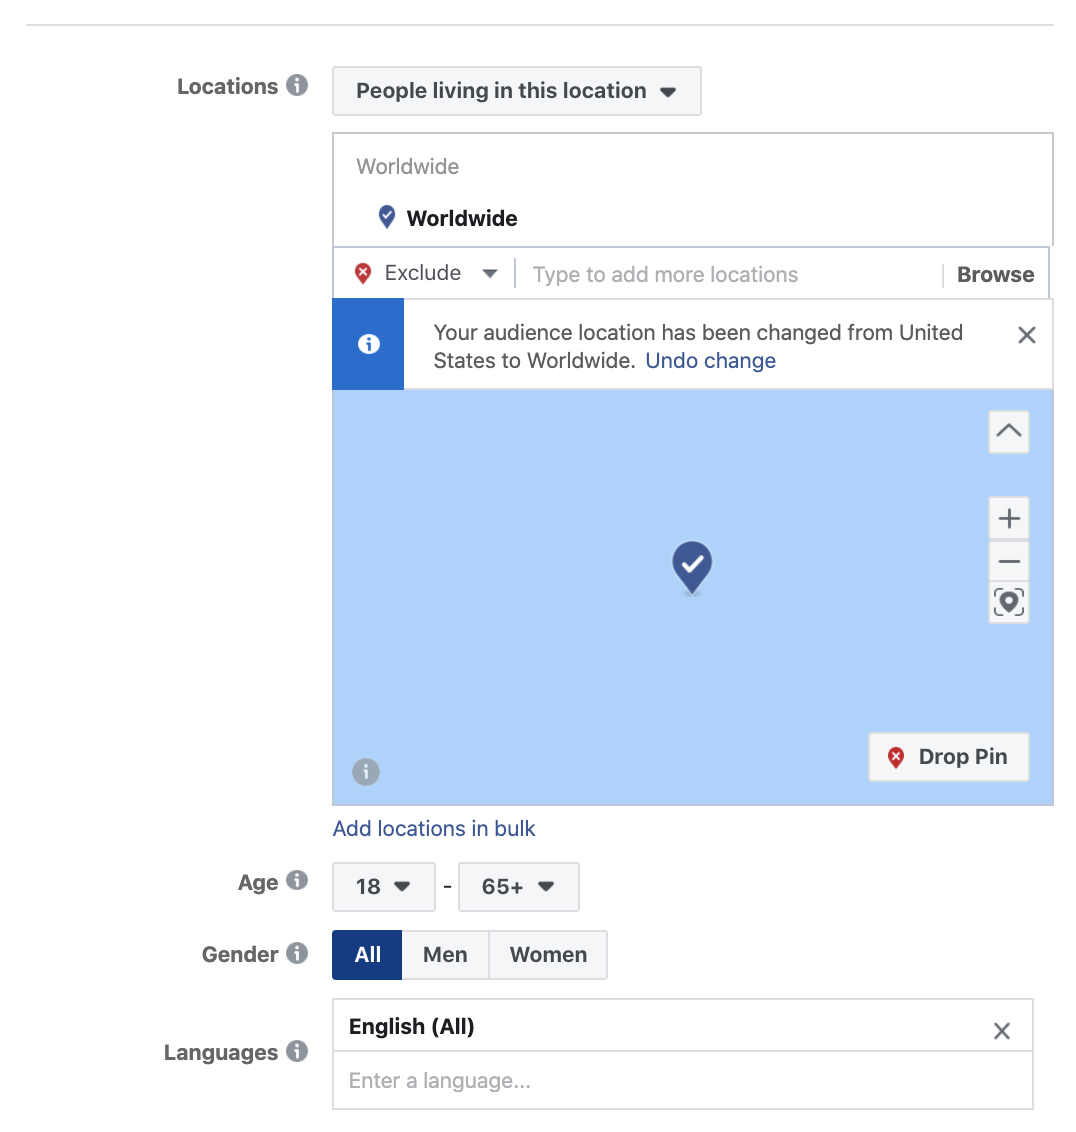
The campaign was targeted worldwide using a very broad audience with the only limit – the English language. Finding new markets is a good way to reach new customers at a lower cost. Facebook definitely considered running ads in a much bigger number of countries than before. This was my first hypothesis.
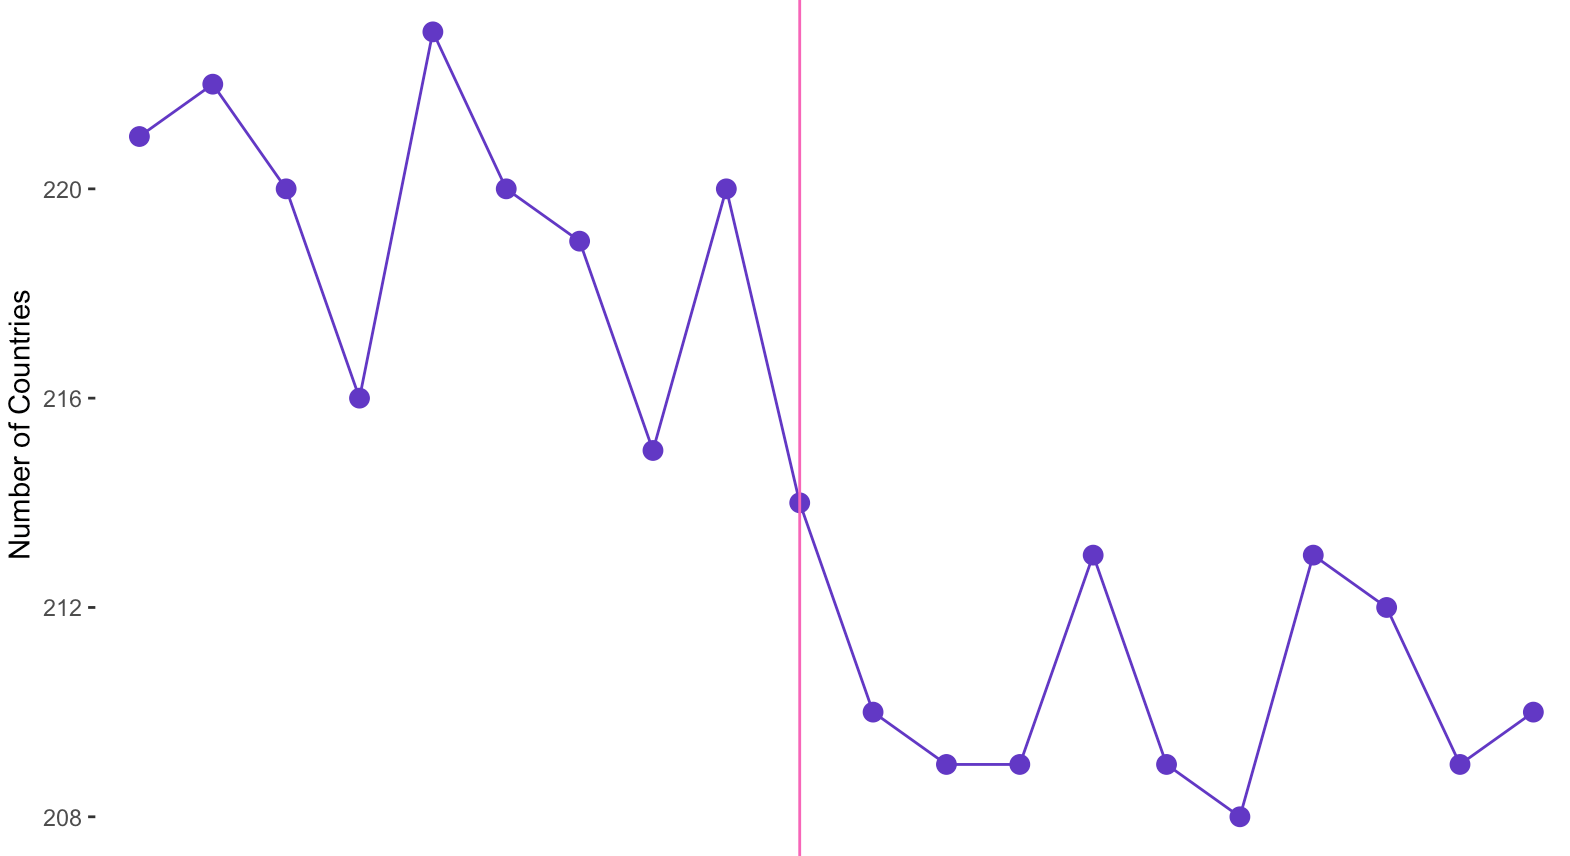
But, as you can see from the graph below, Facebook started showing ads to a lower number of countries. I ran ads in 218 countries on average before, and approximately 211 after the changes.
As you may know, there is a big gap in Facebook advertising costs among countries. I added together different countries in the same campaign and Facebook started relocating the ads budget after the changes in another way. So, let’s discover which countries got the biggest drop in spendings.
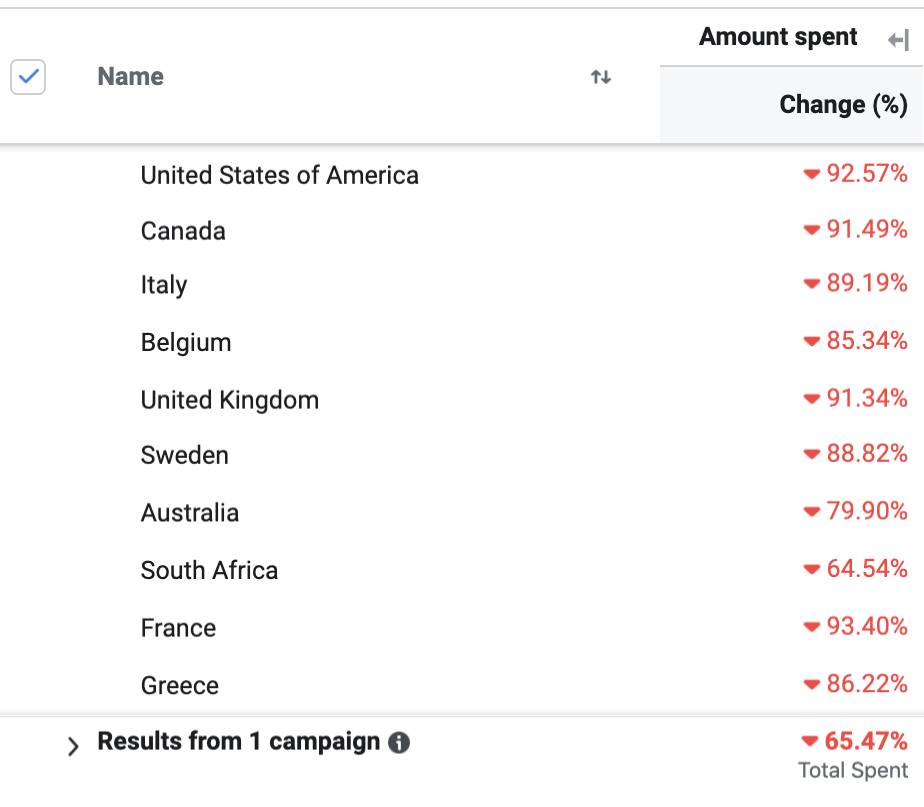
These are the Tier 1 countries, which usually generate up to 80% of sales for businesses I worked with. At this point, it became clear that Facebook relocated daily spend from Tier 1 countries to get lower CPM. Unfortunately, there is no efficient way to analyze changes in daily spending by countries in standard Facebook Ads Manager reports.
It was the last straw for me before I started studying Facebook Marketing API and building some custom reports. There are a lot of things to play with, so if you are not bored playing with data – I definitely recommend you to start with your advertising statistics.
This is the time for RStudio to make further findings.
At first, I tried to make a daily spend animation graphic. There was a map of daily spendings. Something similar we can see in Facebook Ads Manager but that one was with daily breakdown. I couldn’t get any insight from that graph, so the graph is not provided here.
The first attempt failed because I analyzed 200+ countries and visualization was meaningless with this scale.
I decided to create a CPM “benchmark” scale for all the countries for the last year. Then I grouped the countries into 4 quartiles by CPM. The first quartile contains the cheapest and the 4th the most expensive countries. For example,
The First Quartile Countries – Lowest CPM:
Venezuela
Nepal
Vatican City
Algeria
Tunisia
The Fourth Quartile Countries – Highest CPM:
United States
Australia
Norway
New Zealand
Sweden
The difference in CPM between quartiles is huge. The First quartile has a $1.97 average CPM when the Fourth has $26.79 which illustrates a competition level there. The United States has one of the largest populations of online shoppers and due to this, there is also a lot of competition to reach consumers in this location. Other countries with large English-speaking populations like Canada, Europe, and South America are often overlooked.

Now, having this data let’s try to get some insights out of the daily spending data. I am going to split the daily spendings by Quartiles.
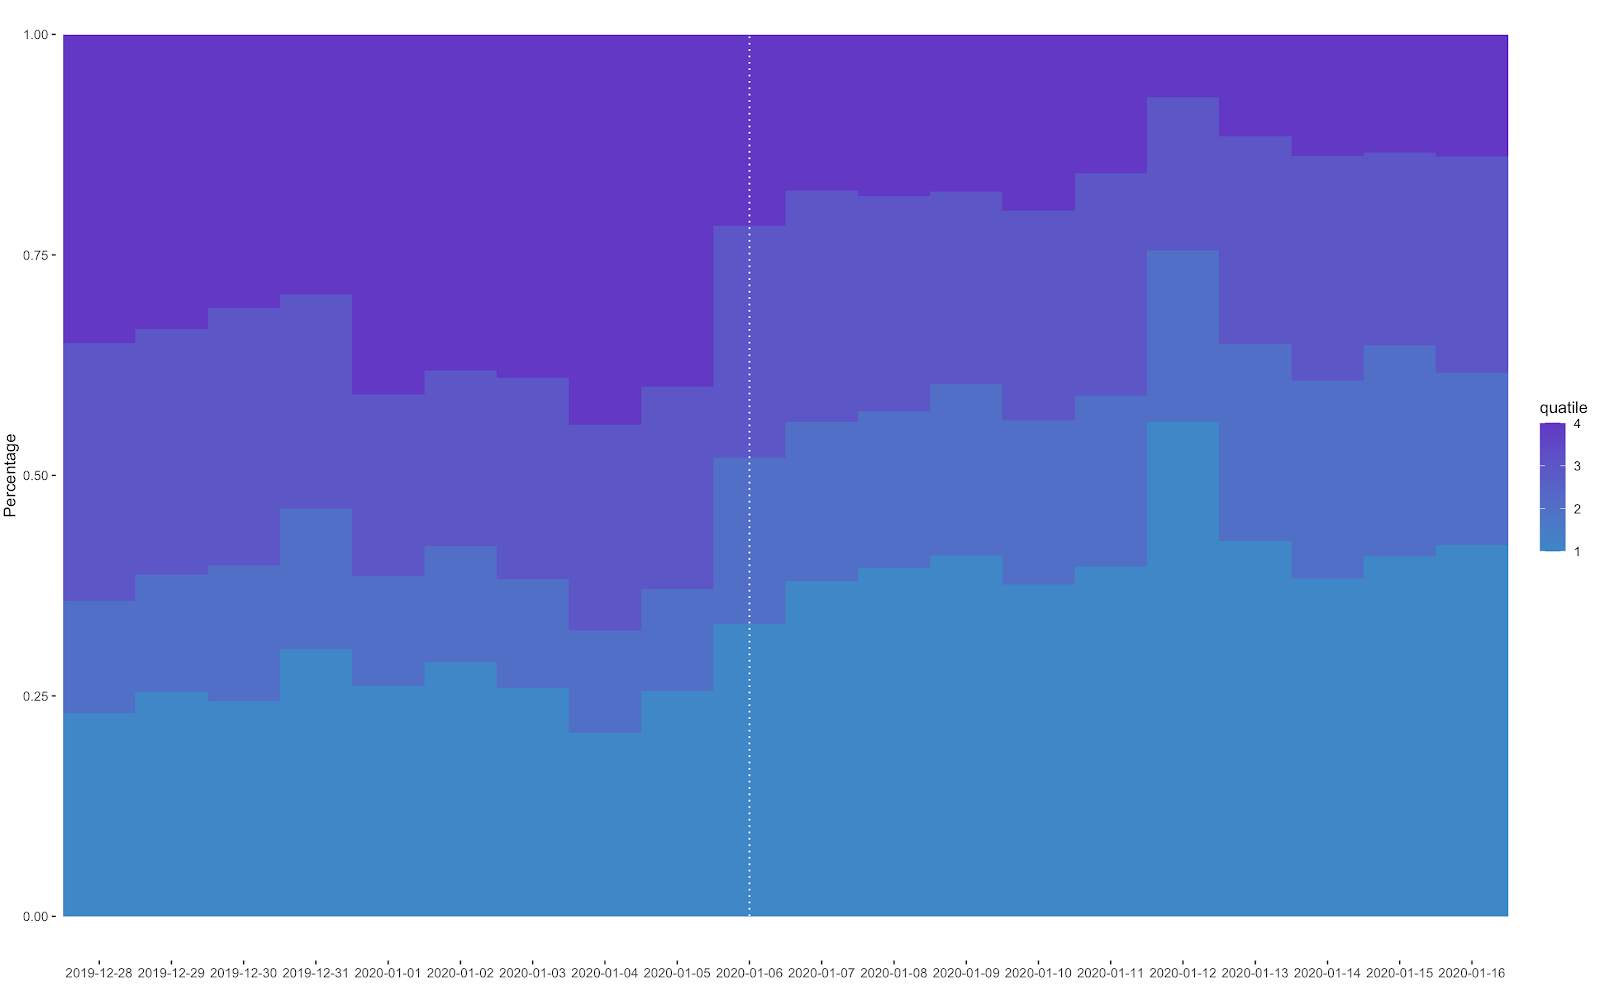
The graph does make sense now. We can see the difference in budget relocation among quartiles before and after the budget decrease. The dotted line shows the exact date when the changes took place.
Decreasing daily budget by 65% caused CPM to decrease by 49%, by relocating the budget to countries with lower competition and CPM. The quality of App installs was lower, much lower. But this is not the point of the research.
The graph illustrates how the Facebook delivery system keeps the location structure day after day. As you remember, the campaign had Worldwide targeting. Once the campaign finished the learning phase successfully, we had a stable set of locations until further editing.
Spending by the time of day
What about other factors? Could we get more data provided by Facebook Marketing API?
Yes! At least one element we can discover – the time of the day.
BuzzSumo conducted an analysis of more than a billion Facebook posts to measure the best ways to improve engagement – in their research, they actually found that posting between 10 pm and midnight saw brands garnering higher levels of engagement. This pretty much directly reflects what Facebook has outlined about how the News Feed works – the more competition, the less probability that your brand posts or ads will make it to the top of the list for more users.
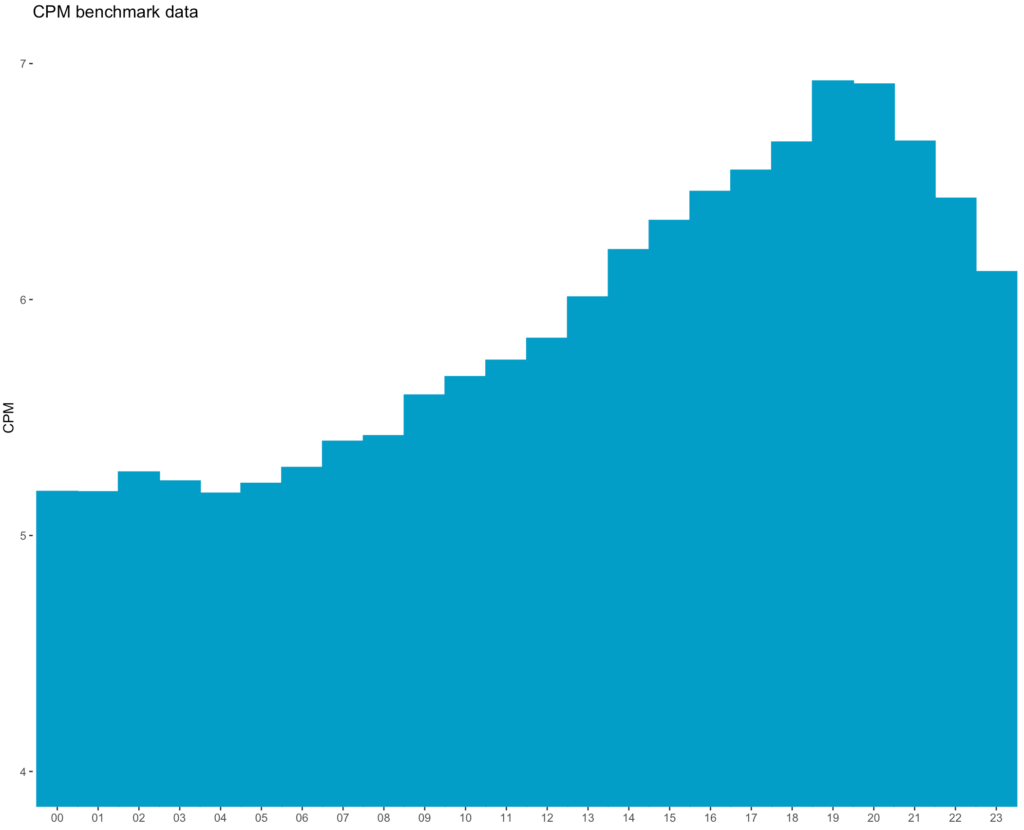
I analyzed differences in hourly CPM during a year. The account had the next CPM costs:
- max $6.9 CPM at 7 pm.
- min $5.2 CPM at 4 am.
We can see a fluctuation of 33% depending on the time of day. The data reflected as a viewer’s time zone, the account time zone has a lower difference.
When your customers see the post at the right time, they’ll be more likely to engage with it, install the app in our case and that tells Facebook that their user is interested in this content, which will have a positive impact on its ranking.
We can see a daily peek in the evening because there is a much bigger competition on Facebook among advertisers for potential customers. It’s a great time to advertise. Facebook knows users’ purchasing behavior and sells the prime time hard.

The daily budget relocation by the time of day before the changes were made. The daily budget relocation AFTER the budget reduction was made.
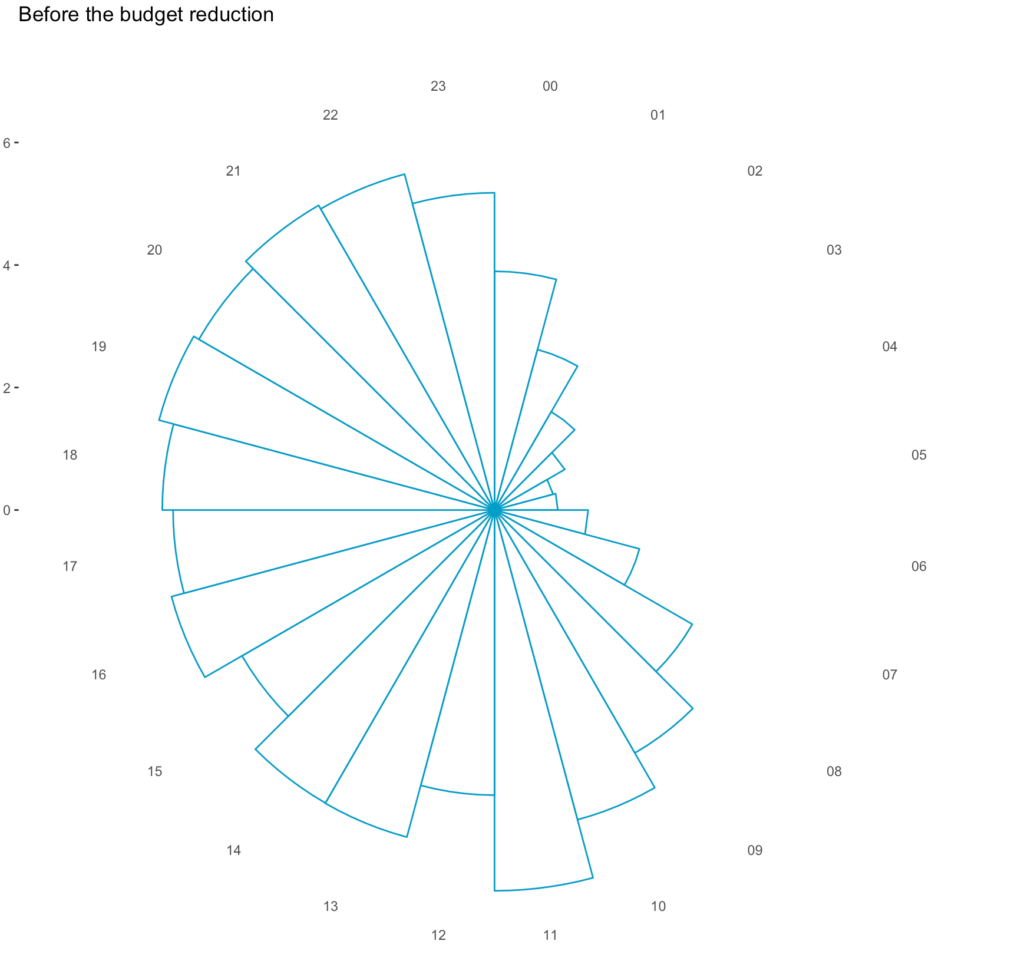
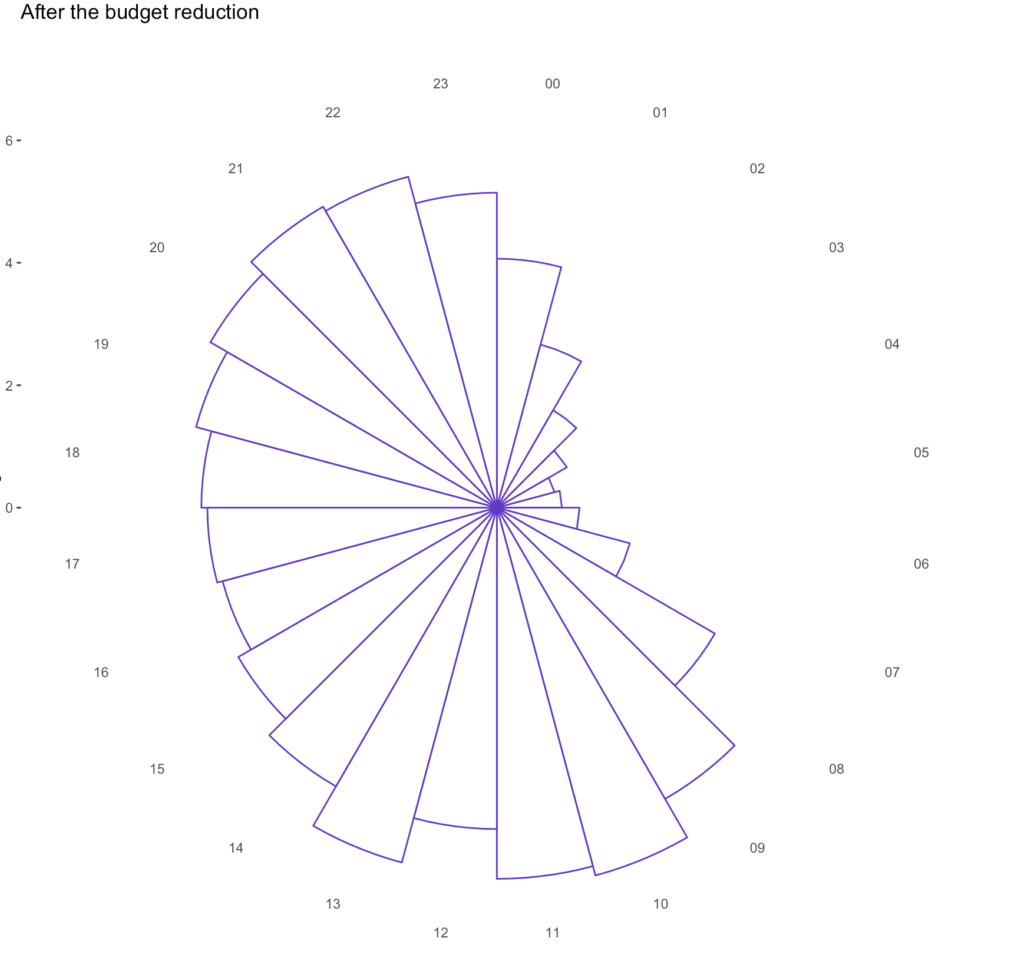
The daily spendings were mainly distributed from 11 am to 10 pm. The ads were shown during the most expensive (we assume, the most efficient ) hours. There was a peak – 11 am, the time most office workers have their “after morning emails” time and scroll their Facebook News Feeds. The distribution seemed natural and had a good return.
After the budget reduction, I got much bigger spendings during morning hours and at night. The office hours declined. The distribution looked more morning oriented, while the office and evening hours were the most efficient.
Facebook distributed the daily spendings for less expensive hours which caused the total CPM decrease.
I am sure there are dozens of other factors which are available or not for our analysis, but even having only two of them analyzed allows me to make a conclusion:
Facebook has a lot of inventory to sell out for all pockets – which makes endless possibilities for advertisers to find the most efficient spot for their ads.
Conclusion
Making big changes in the daily budget could be considered as significant edits by Facebook. “For example, if you increase your budget from USD 100 to USD 101, that isn’t likely to cause one or more ad sets to re-enter the learning phase. However, if you change your budget from USD 100 to USD 1000, one or more ad sets may re-enter the learning phase.”
In my case, the daily budget decrease from $150 to $50 caused the learning phase and I’ve got the unexpected CPM decrease at the end.
After the changes, the location structure was reoriented to cheaper countries. The cost distribution by hours was changed also – I got lower price time spots.
The install quality was lower as well, but this is not the point of our discovery. I am trying to focus on perspectives that the findings could bring to my Advertising strategy.
Summary
- Worldwide targeting is a powerful tool that needs to be fine-tuned for business tasks to fit your business goals.
- I recommend using separate audiences by countries with similar costs, like Tier 1 countries, to make the campaigns more manageable.
- The worldwide targeting could be set up when campaigns finished successfully the learning phase. It is worth testing.
- Create and update an exclusion list, where you put all countries without conversions over time. Exclude these locations from your campaigns. Update the list and test these countries over and over again.
- Scale successful campaigns/groups by copy/pasting instead of increasing a budget.
- Testing everything can indeed make your advertising better. I used to work with a 70/30 formula, where 30% of my monthly budget was dedicated to testing efforts.